
July 2024 Alberta Real Estate Remains Solid With Edmonton Booming

Edmonton Real Estate Market - July 2024 Summary
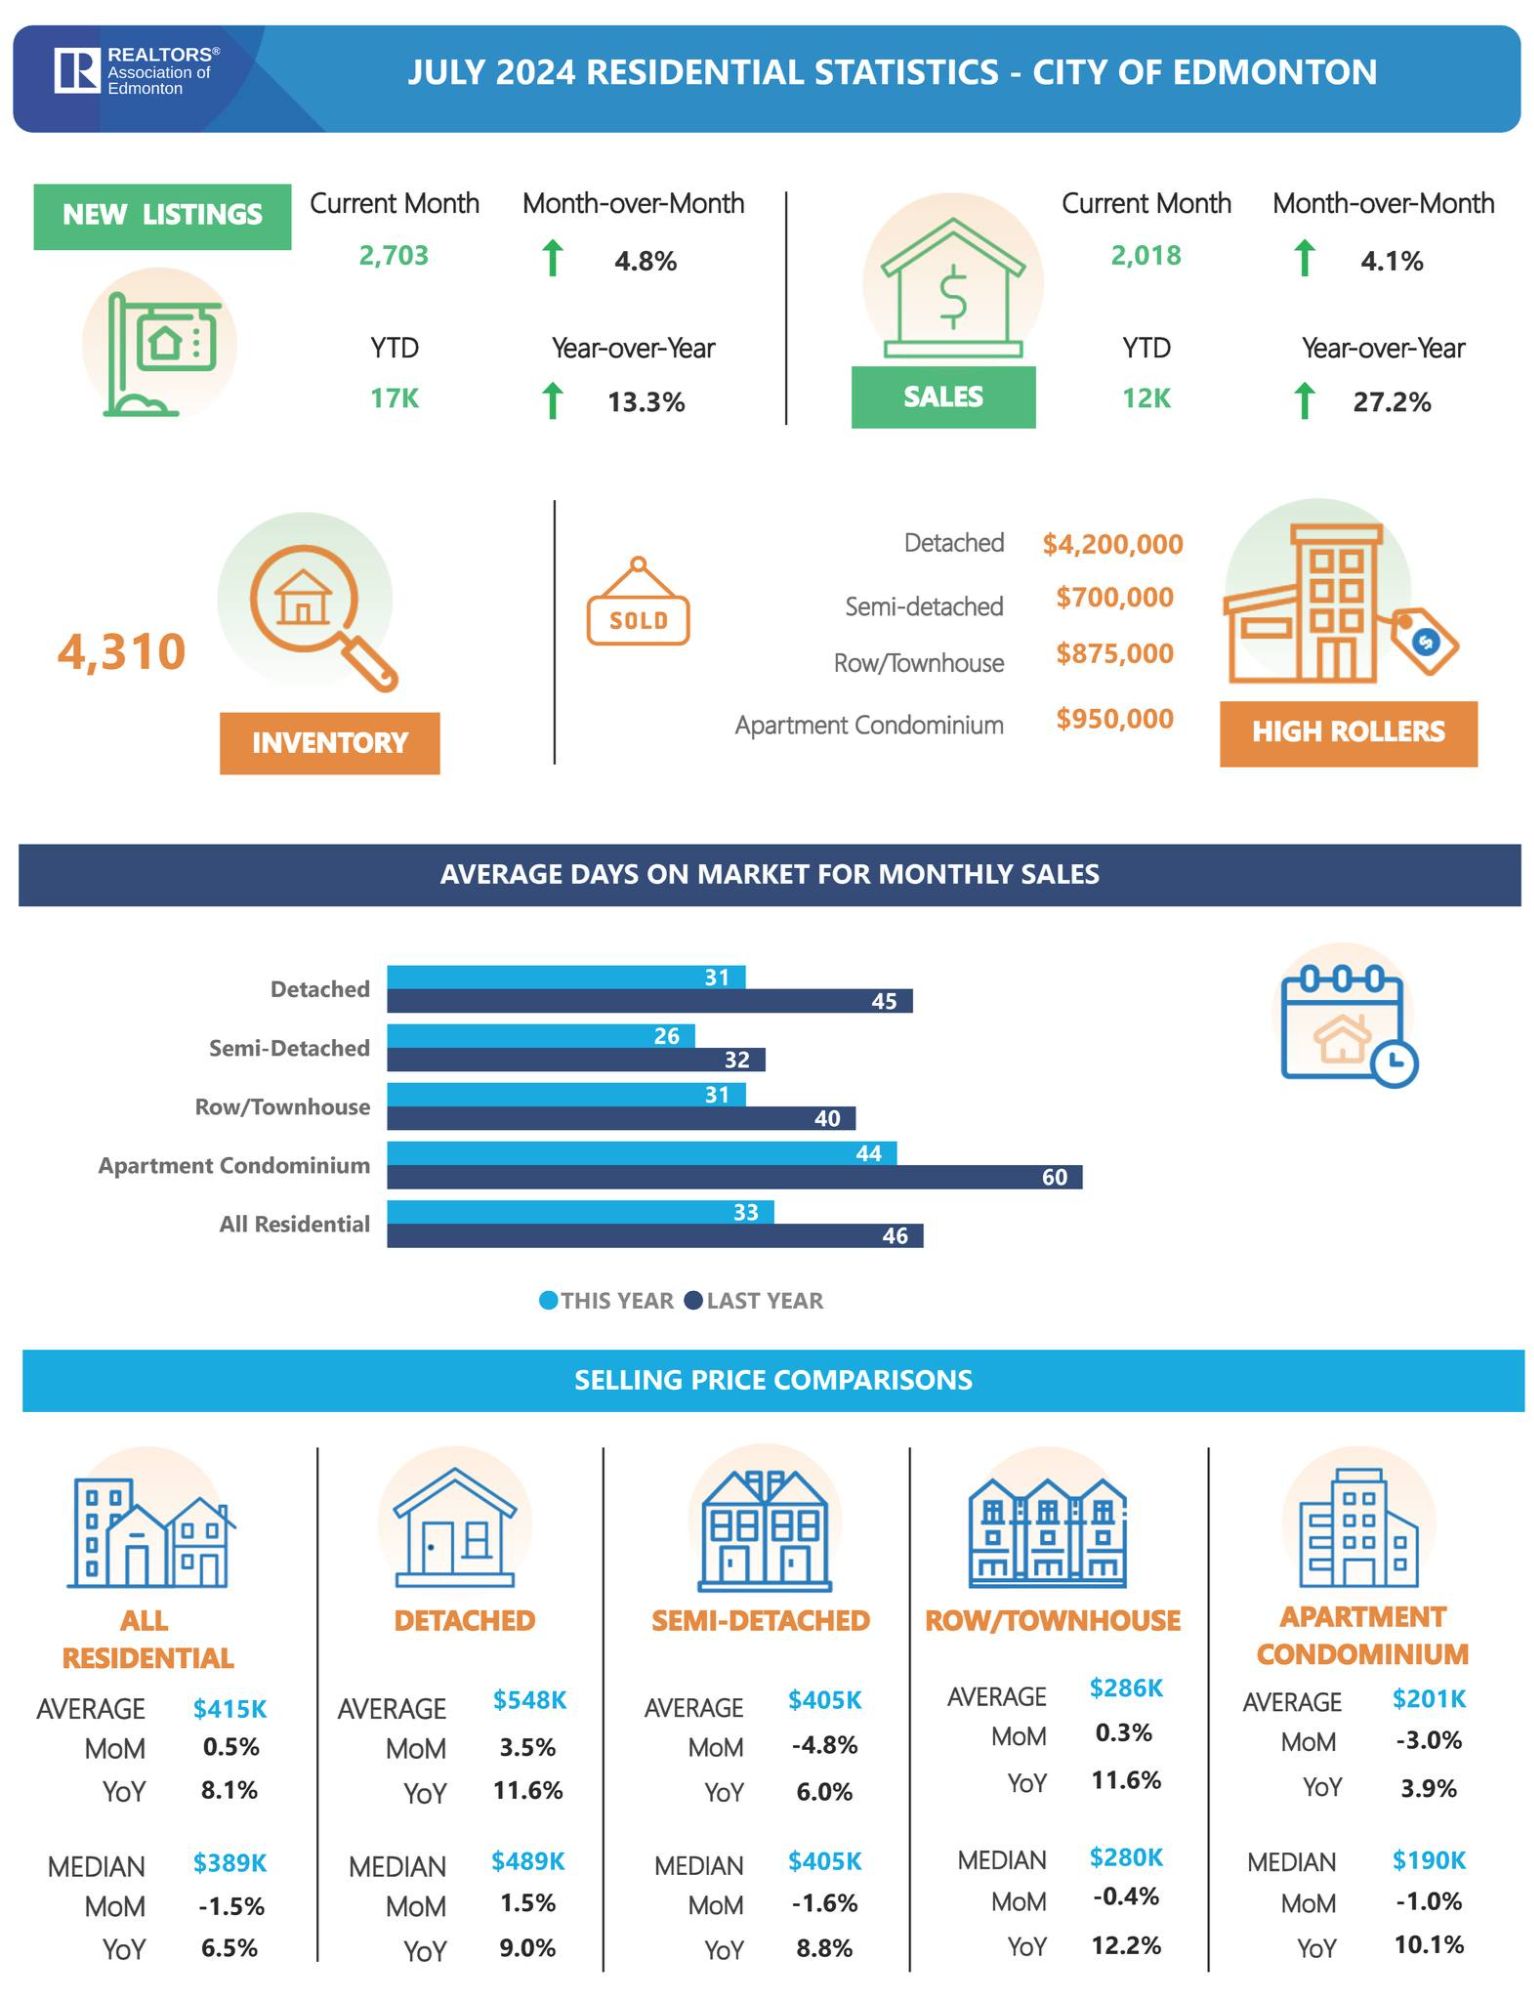
| Category | July 2024 | Change from June 2024 | Change from July 2023 |
|---|---|---|---|
| Total Residential Sales | 2,941 | +3.5% | +27.1% |
| New Listings | 3,729 | +2.9% | +13.2% |
| Overall Inventory | -1.4% | - | -15.1% |
| Detached Sales | 1,708 | +2.8% | +23.5% |
| Semi-Detached Sales | -6.6% | -6.6% | +13.0% |
| Row/Townhouse Sales | +4.7% | +4.7% | +52.0% |
| Apartment Condo Sales | +32.3% | +11.7% | +32.3% |
| Total Residential Avg Price | $440,466 | +0.4% | +7.7% |
| Detached Avg Price | $552,031 | +2.3% | +9.8% |
| Semi-Detached Avg Price | $406,906 | -3.6% | +7.4% |
| Row/Townhouse Avg Price | $292,072 | +0.7% | +10.6% |
| Apartment Condo Avg Price | $204,315 | -3.4% | +4.9% |
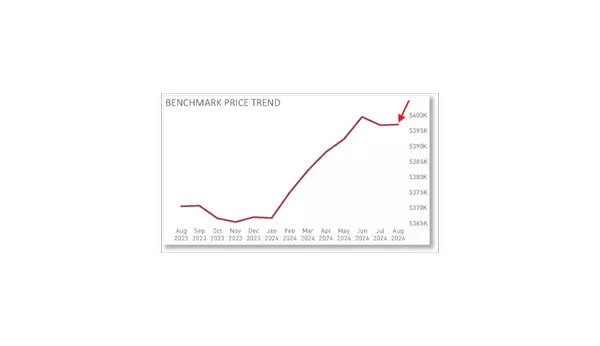
| HPI Composite Benchmark Price | $406,600 | -0.4% | +7.1% |
| Days on Market (Detached) | 32 | +3 | -12 |
| Days on Market (Semi-Detached) | 27 | -1 | -12 |
| Days on Market (Row/Townhouse) | 31 | +6 | -12 |
| Days on Market (Apartment) | 43 | +1 | -12 |
| Overall Days on Market | 33 | +3 | -12 |


Alberta Real Estate Remains Solid With Edmonton Booming

Source: Edge Realty Analytics
Year-over-Year Trends
The year-over-year (y/y) data presents an interesting trend. Edmonton’s sales have risen by 10% compared to the same period last year, while Calgary’s demand has decreased by 13%.

Source: Edge Realty Analytics
Subdued New Listings
Seasonally adjusted new listings in Calgary decreased by 9% m/m, and Edmonton saw a 3% m/m decline. Year-over-year, new listings fell by approximately 4% in Calgary but rose by 1% in Edmonton. The sales-to-new listings ratio remains near 80% in both cities, indicating a highly competitive market by Canadian standards.


Source: Edge Realty Analytics
Rising Inventory in Calgary
Active listings increased by 10% y/y in Calgary but dropped by 16% y/y in Edmonton, with both cities hovering near decade lows. This trend highlights the divergent paths of Calgary and Edmonton. The report further suggests that Edmonton is poised to become the best-performing major Canadian metro.

Source: Edge Realty Analytics
Surging House Prices
House prices continue to climb in both Calgary and Edmonton, with Calgary experiencing an 8.5% y/y increase and Edmonton seeing a 7% y/y rise. The report predicts that by the end of summer, Edmonton’s price growth will begin to outpace Calgary’s. Overall, Alberta’s house prices outperform the rest of Canada, with Calgary’s average prices being projected to exceed the national average within a few years. While Calgary is expected to remain a strong market, the report anticipates that Edmonton will be relatively stronger over the next two years.


Source: Edge Realty Analytics
Increased Construction Activity
Construction activity is on the rise in both Calgary and Edmonton. The number of dwellings under construction increased by 1.4% m/m in Calgary and surged by 6.8% m/m in Edmonton. Excluding rentals, which form an increasing share of new constructions in both of these cities, Calgary remains near record highs in construction activity, while Edmonton lingers near decade lows. This trend suggests that resale inventory levels may have bottomed out in Calgary, whereas Edmonton’s resale supply will likely remain low for another year or more.

Categories
Recent Posts


"My job is to find and attract mastery-based agents to the office, protect the culture, and make sure everyone is happy! "
Unit 1400 - 10665 Jasper Ave, Edmonton, Alberta, T6N1M2, CAN